
MBBR & Biofilm Systems
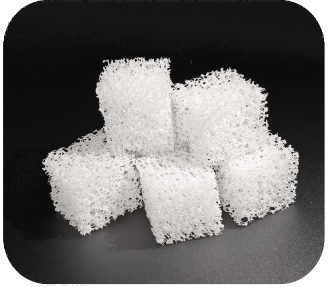
FLuBca® Bio Carrier: 4,000–5,000 m²/m³ Bio-Active Surface Area with 10+ Years Lifespan
-
⚡ 1.5x Capacity Boost: Upgrade existing plants without building new tanks
-
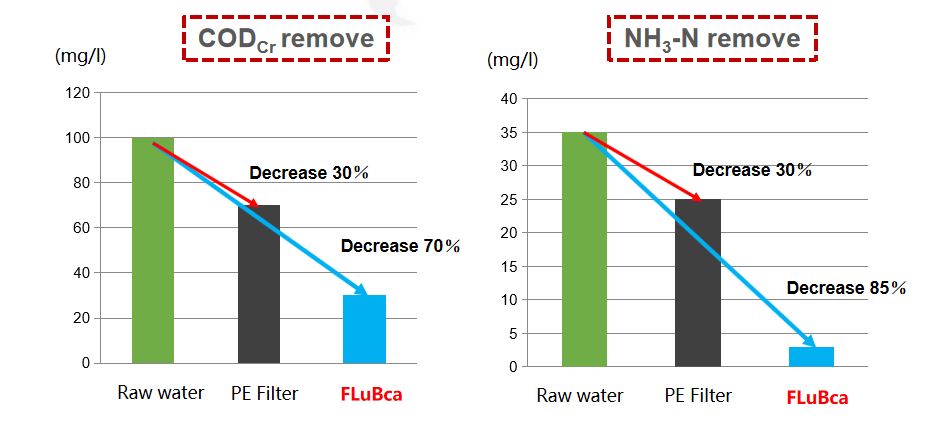
💧 85% Ammonia & 70% COD Removal: Exceptional biological degradation performance
-
🌱 40%+ Sludge Reduction: Significantly cuts down sludge disposal costs
Why Engineers & Plant Operators Upgrade to FLuBca®
Huge Bio-Active Surface Area
Provides 5× higher bio-surface area than conventional PE media, dramatically reducing the required media dosage volume.
Super Hydrophilic & Instant Sinking
Swells and sinks rapidly upon installation, requiring up to 20% lower mixing energy.
Non-Clogging & 10+ Years Durability
Solves traditional sponge clogging issues. Made of modified polyurethane with a 10+ year operational lifespan.
Significant Sludge Reduction
Reduces secondary sludge generation, lowering chemical consumption and sludge cake disposal OpEx.
Ready to Upgrade Your MBBR System?
Contact our engineers today for technical selection, media volume calculation, and sample requests.
Comparison Matrix
| Performance Parameter | Traditional PE Media | Standard Polyurethane Sponge | FLuBca® Carrier |
|---|---|---|---|
| Hydrophilic Property | Moderate (Δ) | Poor (×) | Exceptional (√) |
| Fluidity / Mixing Energy | Moderate (Δ) | Poor (×) | Easy Fluidization (√) |
| Biologically-active Surface Area | 500 ~ 900 m²/m³ | 3000 ~ 4000 m²/m³ | 4000 ~ 5000 m²/m³ |
| Clogging Risk | Low | High | Extremely Low |
| Service Life | > 10 Years | 2 ~ 3 Years | > 10 Years |
| COD & NH3-N Removal | Standard (Δ) | High (√) | Ultra-High (√√) |
Tested Performance & Lab Proof
Comparison test with PE filter
Wastewater sample: taken from outlet of primary sedimentation tank of the municipal sewage plant Wastewater sample condition :
T-BOD=150mg/l S-BOD=60mg/l TN=50mg/l NH3-N=50mg/l
T-COD=450mg/l S-COD=150mg/l SS=200mg/l
Filler filling rate: 25% for each tank
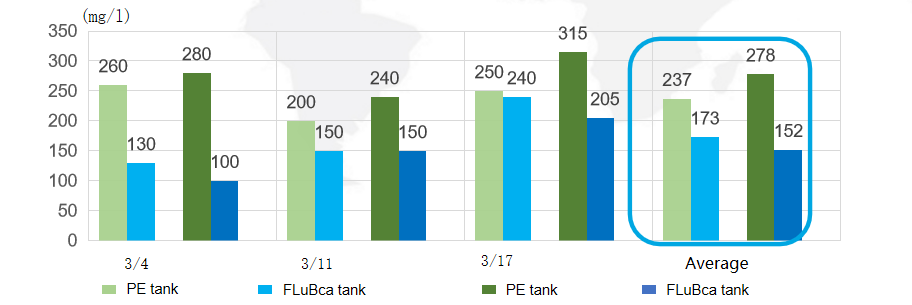
LOW VOLUME OF SLUDGE
Each Test Tank Outlet SS
|
Test tank |
HRT |
Tank outlet SS(mg/L) |
Compared to PE filter, the amount of sludge is reduced(FLuBca) |
|
|
PE filter |
FLuBca |
|||
| Tank 1 | 4.3hr | 200~260 | 130~240 |
27.0% |
| Tank 2 | 8.6hr | 240~320 | 100~210 | 45.3% |
*At 1 times processing load, the PH, DO, water temperature, etc. data are in good condition during the period (design value)